
You’ve probably felt the overwhelm.
You read the blogs and listen to the experts on the steps to take to grow your new blog.
Analysis paralysis sets in with so much varying information on what to do first (or next).
No matter what any blogging teacher tells you, there is one step you must take with your new blog that is critical to your blog success..
(If you don’t have your WordPress blog setup yet, follow this tutorial)
It has nothing to do with your theme, plugins, or SEO.
And you should implement this one thing even if you have no traffic coming to your blog. When you take the steps I am about to show you, your blog will work for you while it grows, giving you peace of mind.
That one thing? Properly setting up tracking and analytics on your blog.
The good news for you is that it will cost you nothing, and you don’t need to be a tech genius to do it.
Why must you do this?
Imagine trying to manage your money without ever seeing or knowing your bank balance, transactions, credit card statements, or investments. You would always be guessing.
Running your blog is the same.
You want to understand precisely who your audience is and what their behavior is on your blog. Once you have this information, you can concentrate your efforts to get the maximum return on your time.
With free tools like Google Analytics, you can set it up once and forget about it.
It will be running in the background and tracking everything for you as your blog grows.
It’s one of those things that you will be kicking yourself down the road if you do not set it up from the start.
In this article, I will show you step-by-step how easy it is to set up tracking on your blog, and how to analyze this data to compound the growth your blog.
But before we jump right in, let me give you a quick example of harnessing your blog data for explosive growth.
By setting up Google Analytics early on my blog Good Food Eating, I began to notice trends in the activity of my readers.
One blog post, in particular, was starting to get a significant amount of traffic.
Identifying Content Trends with Google Analytics
Being opportunity minded, I realized that this post was not bringing me any subscribers, nor was it generating any income.
But, could I expect anything different?
There was no “call to action” within the post.
People would find my blog, reading the content, and leave because I was not instructing them to do anything once they finished consuming the content
So, I decided to run a test…
Within the post, I introduced a simple call to action where people could trade their email address for an ebook. The topic of the ebook being directly related to the subject of the blog post they were reading.
We’ll take a deeper look at how I did this later in the article, but this strategy alone created a 500% increase in my blog subscribers and doubled the traffic to my blog.
Without this data, I would be guessing and spending my time testing things that will not bring a significant return.
When you track your numbers, you make educated decisions about your blog that bring you measurable results.
Most people shy away from tracking and analytics. Likely because it all just seems too technical, too complicated, and you just want to write on your blog.
Trust me, I know how you feel. But, in a few months from now (or less) you can dig into your Google Analytics data that has been tracking in the background and used it to grow your blog traffic or email list.
As Google points out:
“Measurement helps us make good business decisions, without it we don’t know what to change or work on”.
Highly successful bloggers such as Pat Flynn from Smart Passive Income and Darren Rowse from Problogger talk openly about their use of Google Analytics to track progress and make informed decisions around growing their blogs.
Just like highly successful bloggers we can all use our numbers to work out what to change and what to work on, so we can maximize our investment of time, energy, or money.
Today I’ll use my new site Diabetes Meal Plans as an example to guide you through the Google Analytics setup. And I’ll also share what some of the stats mean, what to look out for, and a few tips on how that can help you as a blogger to build your list and traffic.
I’d like to point out that this is not the type of post you just read.
If you do have Google Analytics, then open it up and see if you can gather some tips and intel on how to use it better. If you don’t have Google Analytics installed yet, then follow this tutorial from start to finish and you’ll be up and running tracking your stats in no time.
Setting Up Your Google Analytics Account
The first place to get started is to sign up for a Google Analytics account.
In the top right-hand corner, you can either ‘sign in’ or ‘create an account’. If you’ve set up a Gmail account before, just go ahead and sign into that. If you’ve never had a Google account, or if you want to setup a different email and account for your blog, then click on ‘create a new account’ to get started.
Once you’re inside, you’ll see a panel like this:

Go ahead and click on ‘Sign Up’ and you’ll be taken to the next screen.
Set Up A New Website Account
Once you’re inside, you will be asked to set up a new website. You can complete this process in just a few minutes by filling in the following details.
- Account name – use the name of your blog or business
- Website name – pretty obvious
- Website URL – enter your domain name
- Select your industry from the drop down categories
- Select your reporting timezone – I live in Australia but still have mine set to The U.S. because I do a lot of things in U.S. time. This does not affect your overall stats.
- You can decide who you share your data with, Google and such – leaving the default settings here is fine
You can change any of these preferences later if you make a mistake. But there’s not too much that can go wrong here.
After you’ve gone through that setup, click on the blue button at the bottom to ‘Get Tracking ID’. A pop-up box will appear, and you have to accept Google’s Terms of Service.
Add Your Unique Tracking Code
Next you’ll be given a tracking code that needs to be plugged into your website so your blog can communicate with Google. This is just a copy and paste operation. You DO NOT need to be a tech wizard to accomplish this step.
Step 1: First check your theme
 Look in your WordPress theme settings first to see if you can paste the code directly into it. In your WordPress dashboard look for your theme icon. For example, I use a Genesis theme, and the theme has a unique section in the WordPress dashboard.
Not all themes have this so the other place you can look is under ‘Appearance’, sometimes there will be a ‘settings’ section for your theme in there.
The Google Analytics code goes in the <head> HTML tag of your site. So what you need to look out for is something that says: “Enter scripts or code you would like in the wp_head”. Or it might say: “Paste script here to go before the closing </head> tag”.
If you can do it directly via your theme that’s great but if you can’t, then turn to a WordPress plugin for help.
Step 2: Use A WordPress Plugin
A WordPress plugin is a simple way to get analytics installed and if you think you might ever change your theme, can save you time down the track. But I’ll just point out the differences with these plugins and share what’s best to choose.
Many people like the type of plugins where you can view stats directly in your WordPress dashboard (eg: Google Analytics by Yoast), meaning you don’t have to go inside Google Analytics at all. They are popular because they seem easier, but I want to share a word of warning here. In my experience, plugins like this can slow down your site once you start getting traffic.
Sure you can always change this, but I do think it’s better if you go directly to Google Analytics and get familiar with reading your stats there. It may seem a bit daunting at first, but by the time you work through this tutorial you’ll know what to look for, and you’ll have a bunch of ideas on how to use your stats too.
If I wasn’t using a Genesis theme, I’d use the Code Snippets plugin because it’s lightweight and gives you the flexibility to add other code in future, meaning you’ll have less plugins to be concerned about overall.
Setting Up Your Google Analytics Property Settings
Once you’re inside Google Analytics you’ll see a whole bunch of stuff on the left hand side, from ‘Property settings’ through to ‘Social settings’. It will state all this other stuff like data collection through to search term exclusion, but you really don’t have to worry about setting any of this up.
By default, Google adds all the general tags and metrics you need, so the only one you need to be concerned about is the ‘Social settings’. Click through to that and enter all your social sites.
Here is the example of the social settings on my new site.

Essentially you’re adding all your online real estate to this list. And one very important thing to remember is to make sure you add your own URL as well – www.yoursitename.com.
What this does is show you where your ‘name/ brand’ is getting shared and found.
For example, someone else shares my Facebook page on theirs and traffic comes through from there. So instead of just giving me generic social stats, it makes me more detailed. I’ll be monitoring the difference in my future stats to see how this performs.
Later down the track once you get your basics installed, you can come back to the ‘Admin’ panel to make any additions by clicking on it from the top navigation.
Though I won’t be covering it in this article, I’d highly recommend you also add Google Webmaster Tools to your site and connect it to Google Analytics. Later down the track you might also want to explore adwords and adsense.
Understanding the Google Analytics Dashboard
After all that is done, which will take around five minutes, you’ll finally be ready to check out the dashboard.
To get there, just click on ‘Reporting’ in the top navigation menu. Right now you’ll have zero numbers and will see a flatline in front of you like this.

We’ll go through all the workings in just a minute, but first, let’s test your Google Analytics install to make sure it’s working properly.
Testing To Make Sure Your Install Is Right
On the left sidebar click on ‘Real Time’ and this literally brings up a ‘Real Time’ feature. I think this is a fun and cool feature, and you can often find me sitting in my office with it running on my second laptop. I just like viewing who is coming and going on my site in ‘real time’.
And as John Jantsch suggests, the ‘Real Time’ feature is also great for tracking live campaigns or competitions, reacting to mentions of your brand, and testing ad campaigns. You’ll find in time that there are any number of ways you can get creative and use the power of your numbers.
But, for now we’re here to test our Google Analytics install.
So what I did was visit my own site from Facebook and clicked on a couple of pages, just to make sure it was working okay. While you’re doing this, you should see the ‘Real Time’ feature in action, showing you what pages have been clicked or where the traffic (all of two clicks) is referred from.
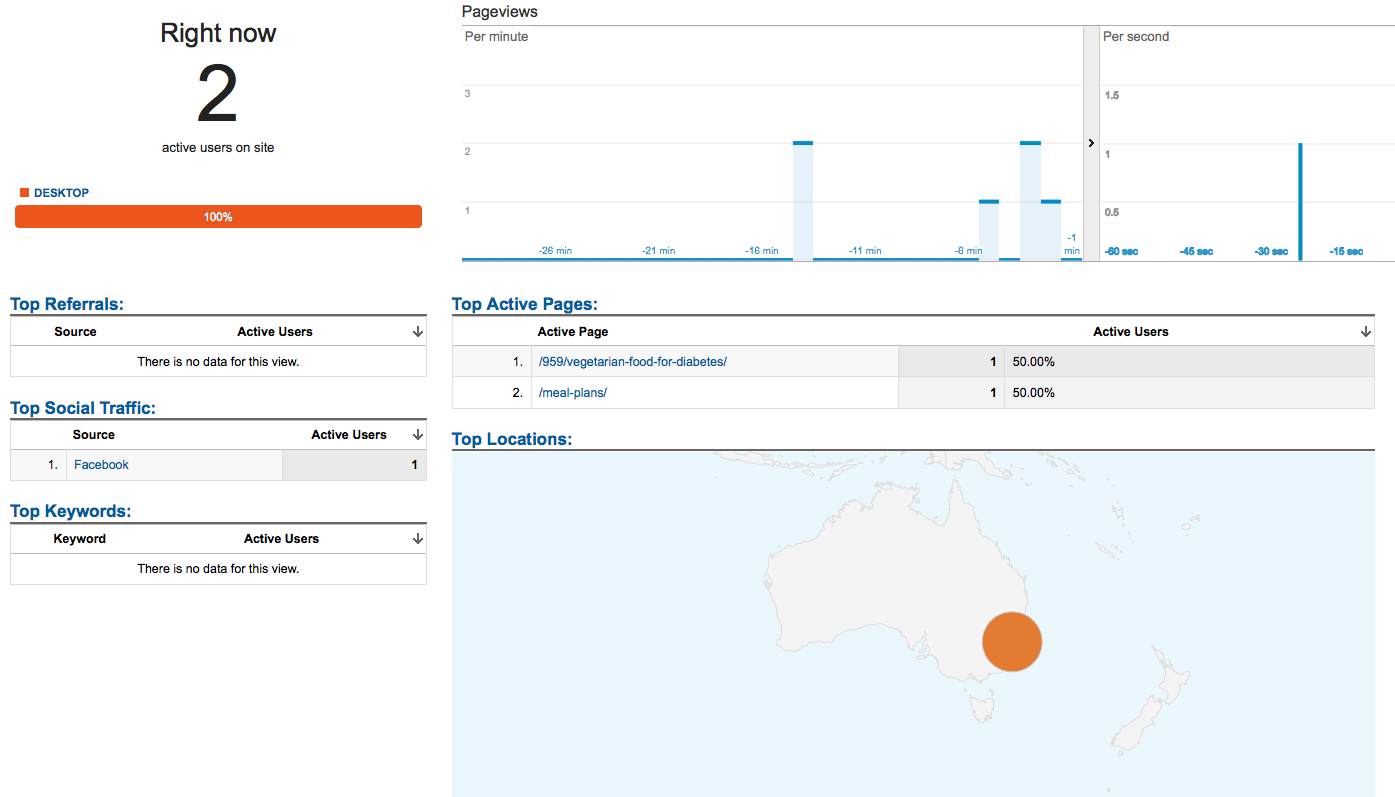
You can monitor the real-time activity of your blog visitors
Once you see some stats coming in on ‘Real Time’ you know it’s set up right, then wait a few hours and some more stats should start coming in for other areas. Of course, if you have no traffic then it might take a few days, but you will slowly see the stats starting to increase.
So that’s it, you’re now all up and running.
Next, let’s get down into the nitty gritty on some of the things you’ll find inside Google Analytics.
You can find all this info via Google’s site, but this is my shortened, more easily understood version. I’ll also share some ideas in each section to get your stats juices flowing, so you can get creative and use your numbers to help grow your blog.
Getting Familiar With The General Stats Dashboard
Let’s start with the dashboard where you’ll view all your general stats, so click on ‘Reporting’ in the top navigation to get back through to your flatline and take a peak.
- Sessions = visits – the number of times users/ unique visitors interact with your site within the date range period. Unique visitors can have just one session or they might have several sessions during that period.
- Users = unique visitors – the number of people visiting your site within the selected date range.
- Pageviews = total pageviews – the total number of pages viewed on your site during the date range period.
- Pages/ Session – the average number of pages per session that a visitor engages with.
- Avg. Session Duration – the amount of time the average session lasts.
- Bounce Rate – the percentage of people who come to your site and leave again straight away without clicking on anything. Having a lower bounce rate is a good sign, but it’s not the be all and end all because bounce rate can be influenced by any number of things such as opening your own site links in a new window instead of the same window, cookies, software, plugins and so forth. Of course, you can always work on improving it but to be honest, I’ve never paid too much attention to it.
- % New sessions – gives you an idea of how many people are brand new vs returning visitors. This is also shown in the new/ return visitor circle. You don’t see the circle in the image above, but it will appear on the right side of your dashboard once you start getting some traffic.
Once you start getting some visitors, your flatline will turn into a graph of your visitors over the selected time period. The default date range period for stats shows the past month, but you can select a custom range from the drop down calendar in the top right hand corner. This means you can track stats on a certain week or even a certain day.
Just be aware that if you change that date range, it also changes stats through all the other panels as well.
Now, none of this probably makes sense to you right now. So, what I’d recommend is that you bookmark this tutorial and once you go through the setup and start getting more traffic and stats, you can refer back to all this info for the details.
Inside Google Analytics you can make special dashboards, shortcuts, or look at intelligence events, there’s tons of stuff you can explore in your own time. But, let’s cut straight to the important stuff, the audience, where they are coming from, and what they are doing on our site.
That’s really what you really want to know.
Understanding Your Audience
One amazing thing about the web is that Google knows all.
Google tracks all of our information, how old we are, what we like based on sites we visit, where we’re located, and what technology we use.
While that might seem scary in some ways, for tracking and stats it’s perfect.
So here’s what you can find out about your audience by clicking on the different panels.
Demographics – age, gender, and interests.
Geography – find out which part of the world your audience comes from.
Behavior – new vs returning – this converts our basic stats into numbers, showing us how many people are new vs returning.
Frequency recency/ engagement – these stats break down those numbers even further and show us how long people stay on our site. For example, I might find out that most of the people only come to my site once and browse a few pages. This is fairly common, but what these numbers also show is our loyal reader stats. Our goal is always to try to increase engagement on our site, so these numbers help us monitor this at the numbers level.
Technology/ Mobile – yes Google tracks what browser our users are using and if our readers are coming from mobile devices.
All of these stats help to give us a deeper insight into our audience. And often it can come as a surprise that our audience is quite different to what we imagined.
For example, I could be fooling myself thinking my audience is only women from Australia, but when I look at my stats I know they are about 50/50 men and women. And my primary source of traffic is the US, followed by Canada, the UK, and then Australia. This helps inform me about things like time to send newsletters, make posts live, activity on social media, what type of content to share, and even the style of writing to be used.
Three Ways You Can Utilize Audience Intel
- Take a look at your audience geographically and think about if that impacts what you share and when. For example, my site is a nutrition/food blog so I have to be aware that the majority of my audience is in the opposite season to me. Depending on your niche, this can make a big difference to the type of content you share.
- If your bounce rate is high take a look at your audience age, gender, and interests and think about your message to market match. Meaning is the message you’re sharing matching the market you’re sharing to? Chances are if your bounce rate is high, you could work on improving it.
- Are people visiting your site from mobile devices? Do you have a mobile friendly site? What you will likely find is that a large majority of your site visitors visit via mobile, so I think it goes without saying that mobile friendly is a must.
Acquisition: Where Our Traffic Is Coming From
Now we know a bit more about who our site visitors are, we can turn to learning about where they are coming from. So go ahead and click on ‘Acquisition’, you’ll see quite a few sections listed here but all we need to delve into right now is the ‘Overview’ section.
You can find everything you need from this section, and though you can explore some other sections, you’ll find there is a lot of overlap. So for simplicity sake, let’s just stick with the overview.
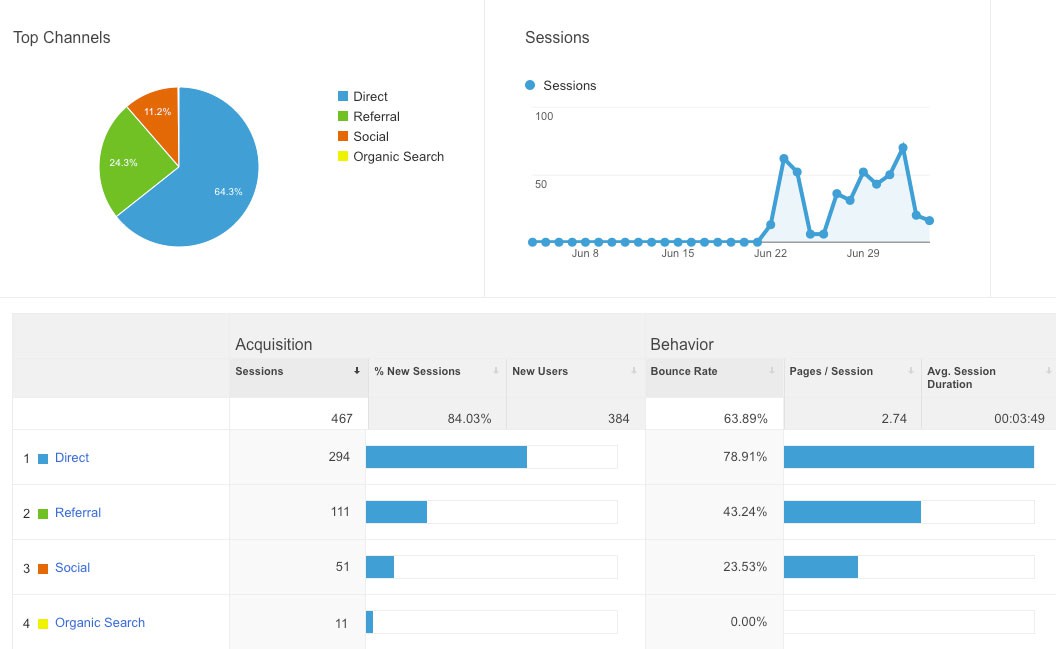
Traffic Sources within Google Analytics
As you can see from the image above, this is where we will start to see where our traffic is coming from, and it will be broken down into four sections: Direct, Referral, Social, and Organic.
So let’s break these down a little more.
Direct – direct users of your site have no recorded browser history and come from typing your site link directly into a search engine. Some of these stats can also be you visiting your own site, which is likely the case with my stats above. You can use a filter to exclude internal traffic, junk and bots, which is recommended, but it’s a bit too technical for this tutorial. If you don’t do it for now, it won’t make a ton of difference anyway. Direct traffic also includes traffic that Google can’t track in any of the other categories.
Referral – referrals from other sites that are linking to or sharing your content.
Social – shows you which social sites your traffic is coming from – Pinterest, Facebook, Twitter etc.
Organic – the keywords people are using to find your site via search engines such as Google, Yahoo, Bing, and so forth.
I really like the ‘Acquisition’ section because just digging into these four sections a little more closely can really help us in lots of ways. And when you get a bit more skilled you can track a little closer by setting specific goals.
Three Ways We Can Utilize Acquisition Info
- Open up the ‘Social’ section and you’ll see a breakdown on where your traffic is coming from socially. You can find out which one is the most popular referrer for your niche, and spend more of your time working on that specific social platform rather than waste your energy elsewhere. For example: I discovered that Pinterest was great for sharing nutrition/ food content, so I stopped spending so much time on Facebook and concentrated on building my Pinterest profile instead. You can also rediscover posts that are popular on social media and reshare them. If you want to you can create segments to track specific social media stats, it’s not essential but can help you track a little closer.
- Take notice of your ‘Referral’ traffic and connect with the people who are sharing your stuff. For example: You can go thank them for sharing it, share their stuff back, build great relationships, and see if you can work together in mutually beneficial ways.
- Open up the ‘Organic’ section and see what kind of search terms your site is being found for and think about how you can use this in creative ways.
Using Acquisition To Grow Your Email List
Let’s drill down into point #3 a little more and I’ll share one method I’ve used on Diabetes Meal Plans to grow my email list, even though it’s only a new blog.
Once you have some posts published and you start seeing ‘Organic’ search terms appear, open them up and see what you can discover.
I wanted to create a lead magnet to help increase subscribers, so I turned to my ‘Organic’ search terms to discover what I could find.

When you open up your ‘Organic’ search terms you will see the top 10 search terms, so think about how you can use this info.
As you can see from the search terms it was ‘blood sugar level chart’. It’s been at the top from day 1 and lots of the other terms starting to pop up now are also directly related to this search term – ‘blood sugar levels chart’, ‘diabetes blood sugar chart’, ‘diabetes sugar levels chart’. Take a look for any patterns like this that might help give you some ideas and inspiration.
 This inspired one of my lead magnet ideas and I decided to put together a ‘downloadable blood sugar levels chart’ for my new readers. In this instance it was pretty easy. I just took the content from a post I’d already written on the subject over here.
If you have a post like this yourself, all you have to do is copy that info, paste it into a word document, convert it into a pdf, make a good image for the cover, create an eBook cover, and set up an opt in box to put on your posts.
Then you can instantly start collecting subscribers and building your list.
Think about your own acquisition stats. Is there a popular search term or set of search terms? Can you use this to write more content around that topic? Since this content is popular and being found via search engines, can you develop your ‘opt-in’ lead magnet to giveaway and encourage more subscribers?
These are just a few ideas, and as you can see there are lots of creative ways you can use your stats to help guide the actions you take to develop your blog.
Behavior: What Are Our Web Visitors Doing?
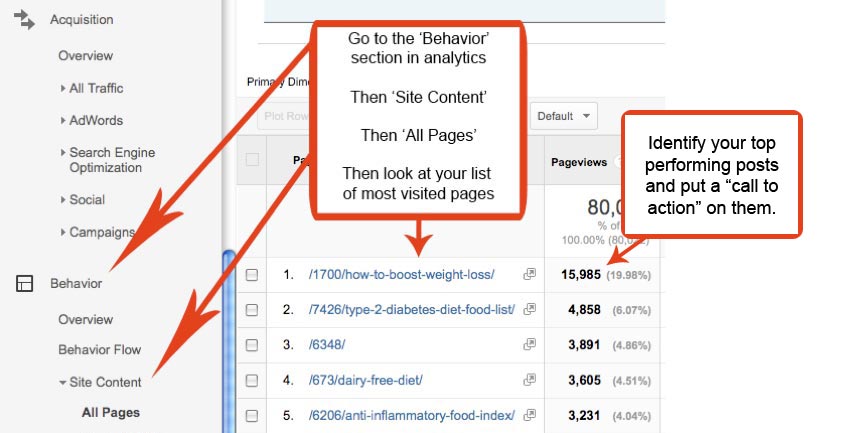
The last section we’re going to learn about today is the ‘Behavior’ section. If you click on that from the Google Analytics sidebar you will again see a long list of things from ‘Overview’ through to ‘In-page Analytics’.
In time you can delve deeper into all these sections, but for simplicity we’re only going to focus on ‘Site content’, so let’s explore that now and how you can use it.
When you click on ‘All Pages’ it will open the list of pages being visited on your site, from most amount visited to least. So from this panel you will see what your top 10 most popular posts/ pages are on your website. You can use the arrows from the bottom right hand corner of the page to scroll through subsequent pages. Or if you want the stats on one particular page, use the search bar to find it.
That’s the great thing about these numbers, is you can be as broad or as specific as you need to be.
Using Behavior Statistics To Grow Your Blog and Business
As I mentioned at the beginning of this article, I identified the number one traffic page on my Good Food Eating blog to grow my list, and I did this using ‘Behavior’ stats.
It was a post about ‘How to boost weight loss’. So, I took a fresh look at the post and noticed it had no call to action and no opt-in incentive.
I added a simple eBook download and embedded that into the post by adding a call to action.

Example of a Blog Post Free Download Call To Action
The opt-in offer is related to the content in the post.
Seven days later, 129 people joined my list from that one blog post alone.
It’s been about eight weeks now and I have added 1,329 new subscribers on that list that I wouldn’t have had before.
If you find your top ten to twenty popular posts and do this, you will soon see your email list grow quite rapidly.
Worth the effort of a little detective work? Yes.
Worth installing Google Analytics? Absolutely!
This is just another example of how you can use your numbers to inform your actions and reap the benefits.
So there you have it.
Your guide to getting started with Google Analytics, with lots of ideas that I hope will get your creative stats juices flowing.
Closing Thoughts
Tracking your stats and using them helps you work smarter, not harder.
So if you haven’t setup your Google Analytics account yet, make a commitment to follow this tutorial from start to finish. Your numbers will be tracking in the background and you will be glad that you did spent the time to implement this, as this data will be essential to the growth of your blog.
If you do have it all setup but haven’t spent some time thinking about your numbers, now could be the perfect time to do that.
So now that you’ve read this post, are you looking forward to tracking your stats (maybe even excited about the possibilities)? Have you had some inspiring thoughts? Or do you have a few stats we can brainstorm together?
Leave your thoughts and comments below.


Jedha Dening
Professional blogger, stats geek, tactical list builder, content marketing strategist, funnel creation queen, freelance writer, coach, and consultant.